Coin Alpha: November 2020 Outlook


Allocation Model for Digital Assets
In this segment we maintain a model allocation for each month, consisting of most significant digital asset classes, including Bitcoin (BTC), Ethereum (ETH), Large-Cap, Mid-Cap, Small-Cap, and DeFi (Decentralized Finance). The assets are evaluated by placing them in following five categories:
A ++ (Accumulate)
A + (Slightly accumulate)
0 (Neutral)
R - (Slightly reduce)
R -- (Reduce)
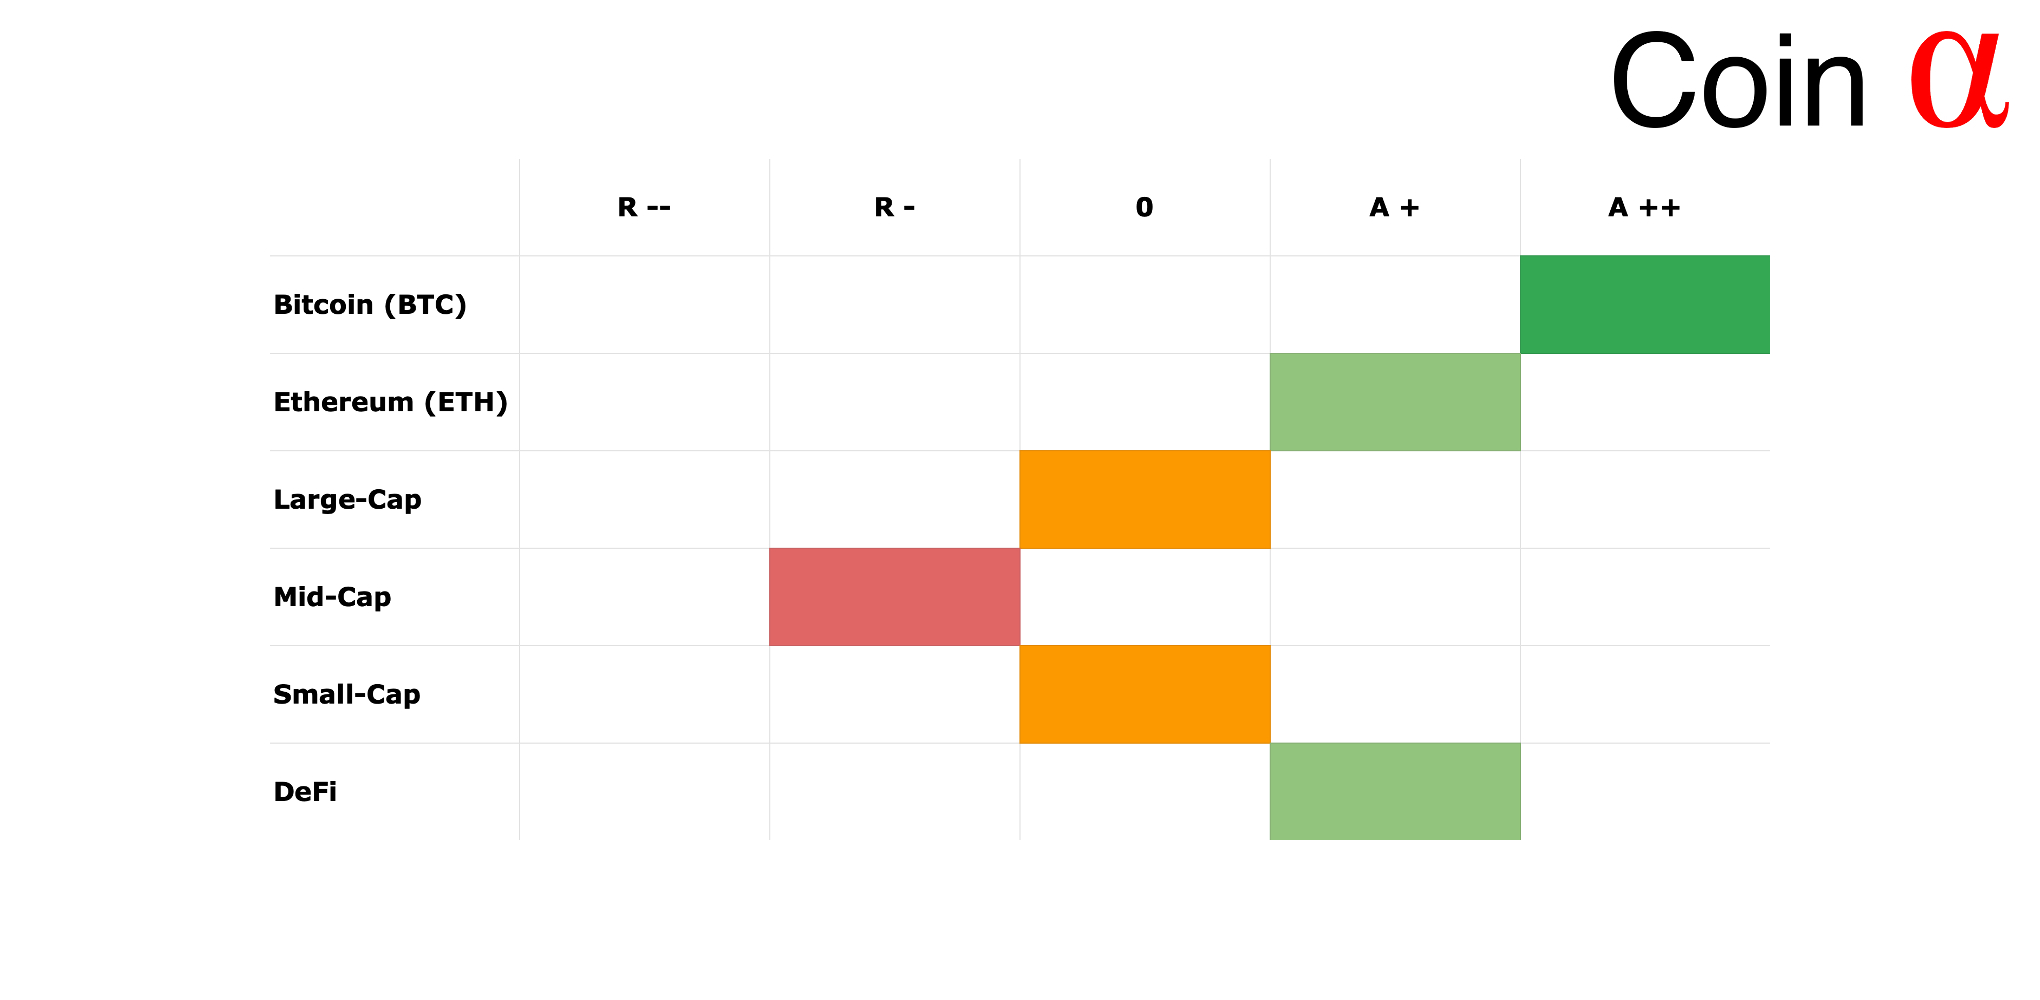
Bitcoin (BTC) / A ++
Bitcoin (BTC) has been re-segmented into A ++ (accumulate) class from previous A + classification. Bitcoin’s fundamentals are looking particularly promising now ahead of the U.S. 2020 presidential election. Bitcoin acts as a hedge to increasing risk and it’s easy to estimate global uncertainty to continue, regardless of the election result.
Ethereum (ETH) / A +
Ethereum (ETH) is placed in the A + ( slightly accumulate) segment. Ethereum is the main ecosystem and platform for future decentralized finance (DeFi) and decentralized applications (dapp). Ethereum’s future growth will be fueled by increasing amount of decentralized future products and services. Ethereum’s growth looks promising, yet it might be slightly bypassed by Bitcoin.
Large-Cap / 0
Large-Cap digital assets, usually the top 10 cryptocurrencies, continue in the 0 (neutral) segment. The cryptocurrencies with large market caps are likely to be correlated with bitcoin, yet they might be eclipsed by the escalating amount of decentralized finance projects.
Mid-Cap / R -
Mid-Cap digital assets continue in the slightly negative territory (R -). The Mid-Cap digital assets are usually projects with medium-sized market caps and cryptocurrencies in this segment are somewhat old. As they’re less known by retail, some of them might easily be replaced by future DeFi products.
Small-Cap / 0
Small-Cap digital assets, usually the mass of cryptocurrencies with small market caps, continue in the neutral (0) category. Small-Caps are usually niche-class cryptocurrencies making them highly volatile. Small-Caps offer considerable upside for a veteran trader, but they might be notoriously illiquid.
DeFi / A +
DeFi, or Decentralized Finance, assets have been placed in the A + ( slightly accumulate) segment. DeFi platforms are quickly expanding in value and quantity, we expect DeFi to be one of the major drivers for cryptocurrency industry in upcoming years.
The Impact of November U.S. Election
We have passed the November 3rd U.S. election day, however the situation remains somewhat unclear. On a larger scale, 2020 election is an interesting reference point to future political landscape in U.S. and broader global community. The recent data shows victory for Biden, yet Trump hasn’t clearly accepted the results, for now. We compiled the most likely impact of each candidate on different asset classes.
Estimated Impact on Bitcoin and FX Markets
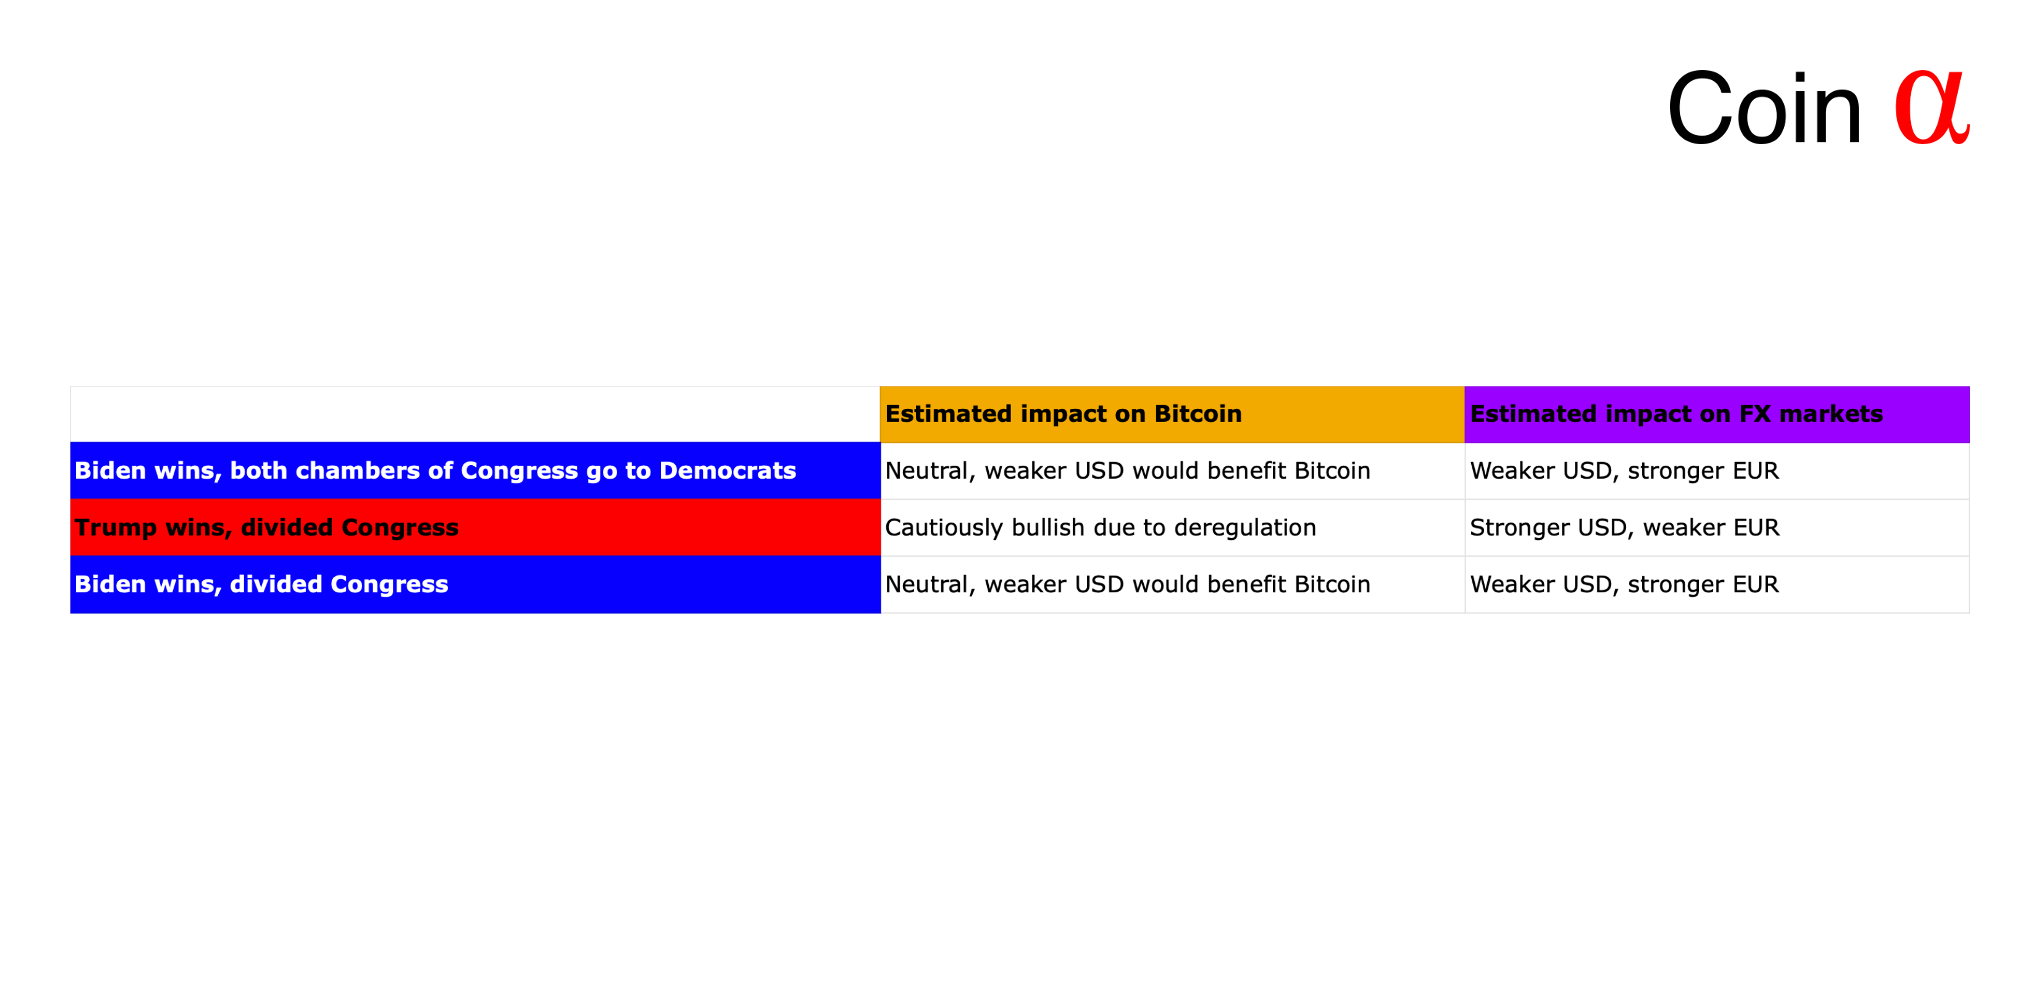
Assuming Joe Biden’s victory over Donald Trump, the following politics would likely lead to weaker U.S. dollar (USD) and stronger euro (EUR). By historical data, weak USD would be bullish for Bitcoin (BTC). Trump’s victory however would lead to stronger dollar and weaker euro, possibly offering some resistance to Bitcoin. Nevertheless, Trump would likely prefer deregulation, benefiting Bitcoin and digital assets holistically.
Estimated Impact on Foreign Policies and Regulation
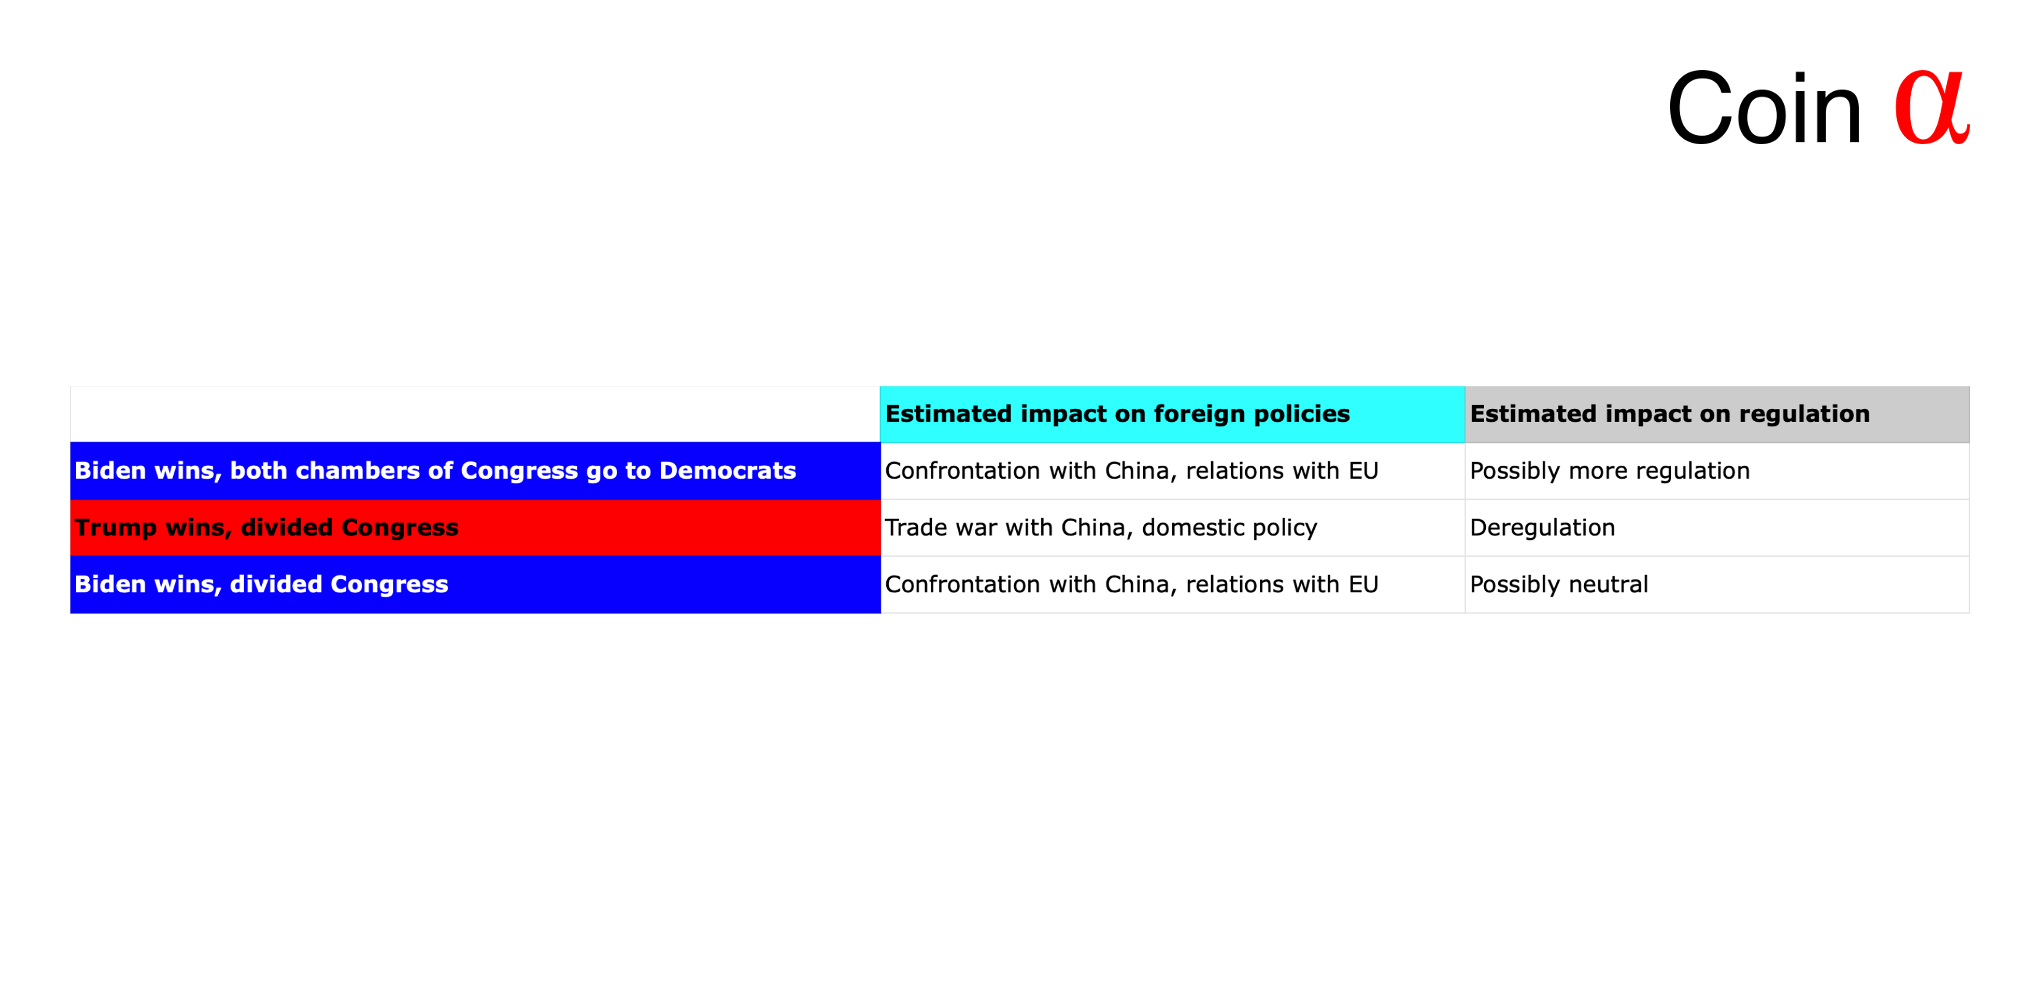
Biden’s victory over Trump would likely continue the current confrontation with China and re-strengthen the relations with European Union (EU). Trump would most probably focus more on domestic policies and escalate the trade war with China. Biden is estimated to increase regulation, while Trump would deregulate, instead.
Estimated Impact on Fiscal Stimulus
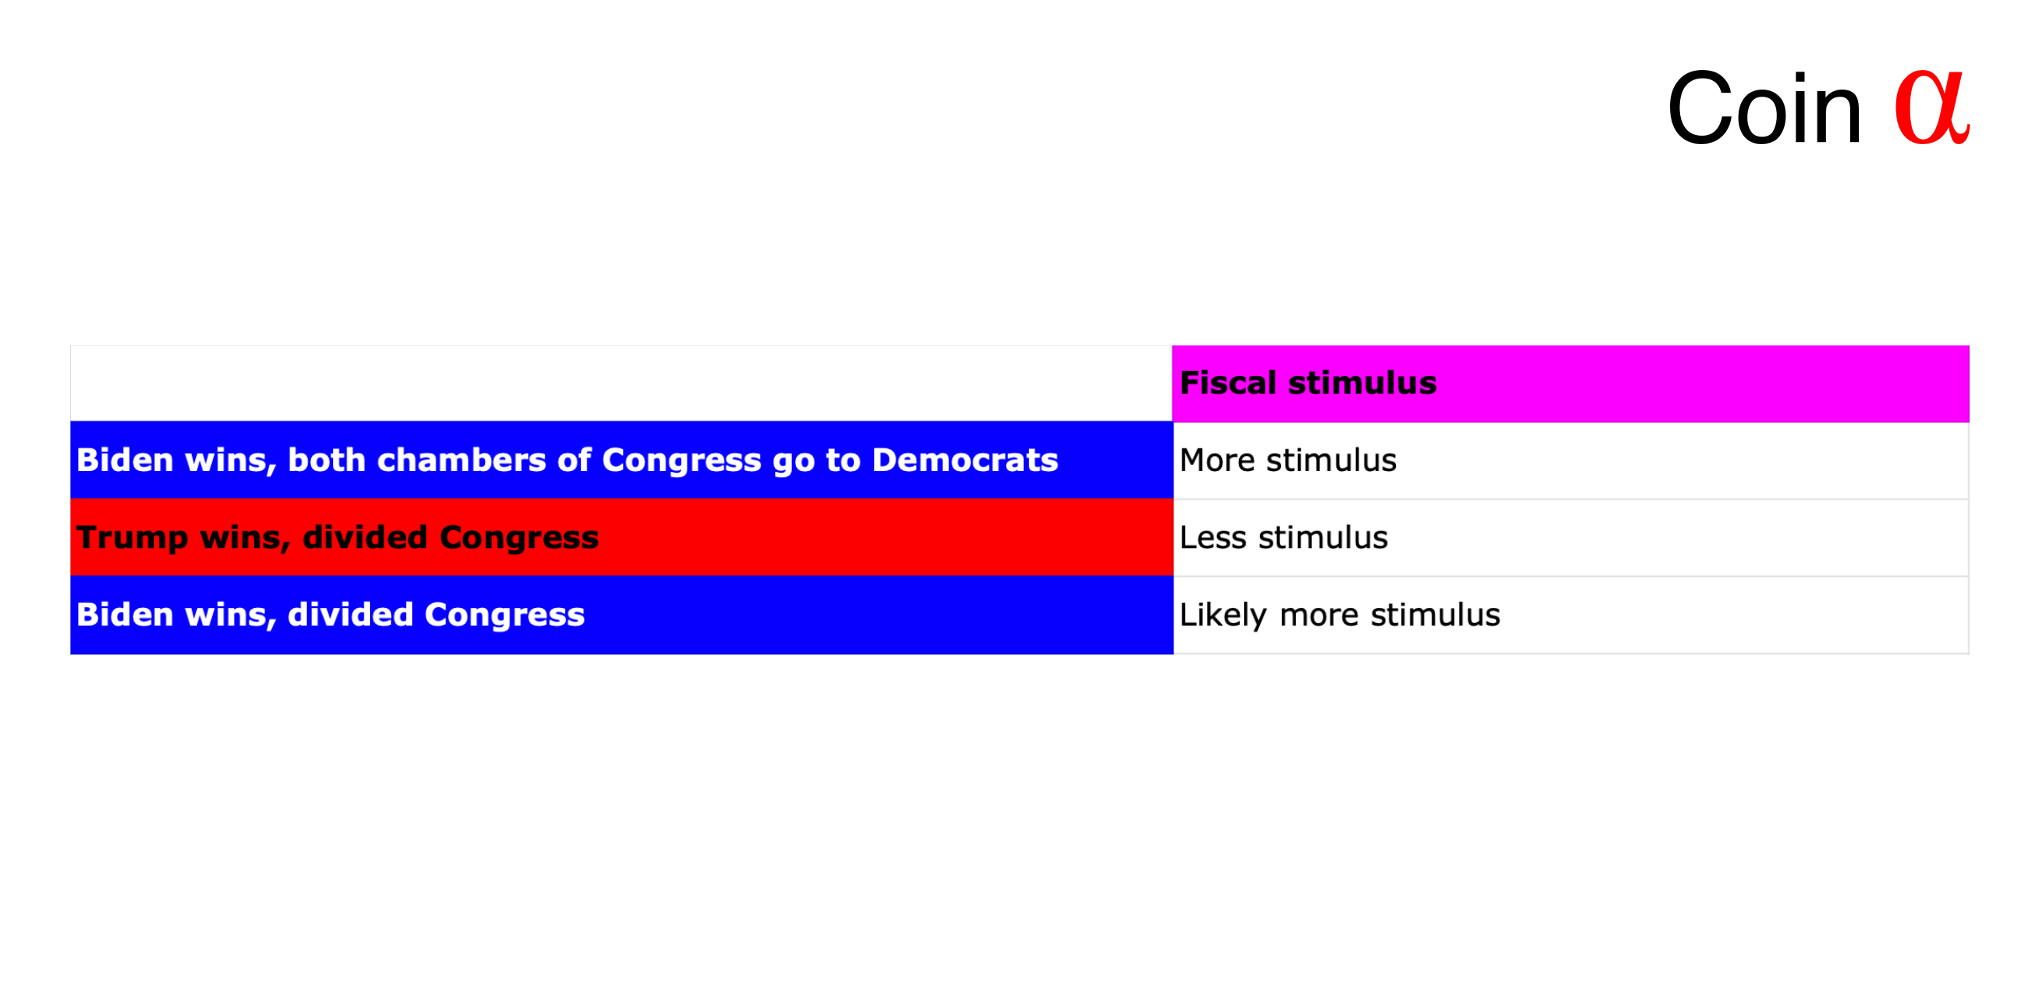
The total monetary base of the United States has increased to 4,8 trillion dollars (USD) in August. Representing 1,4 trillion USD increase in 2020 alone, rising from January 3,4 trillion and peaking at 5,1 trillion in May. 22 percent of the total dollar amount in circulation was created during 2020 alone. Biden would arguably increase the amount of stimulus and Trump decrease it.
Bitcoin (Digital Gold) Eclipses Gold
Price Performance

Bitcoin (BTC), often considered as “digital gold”, has sovereignly eclipsed its benchmark gold since the beginning of third quarter 2020. Since July 1st, bitcoin has climbed from $9K levels into close proximity to $14K. This climb represents a 40,74 percent increase in asset price. Gold however has stayed relatively flat since the early Q3, rising a modest 4,95%.
Stock-to-Flow (S2F)
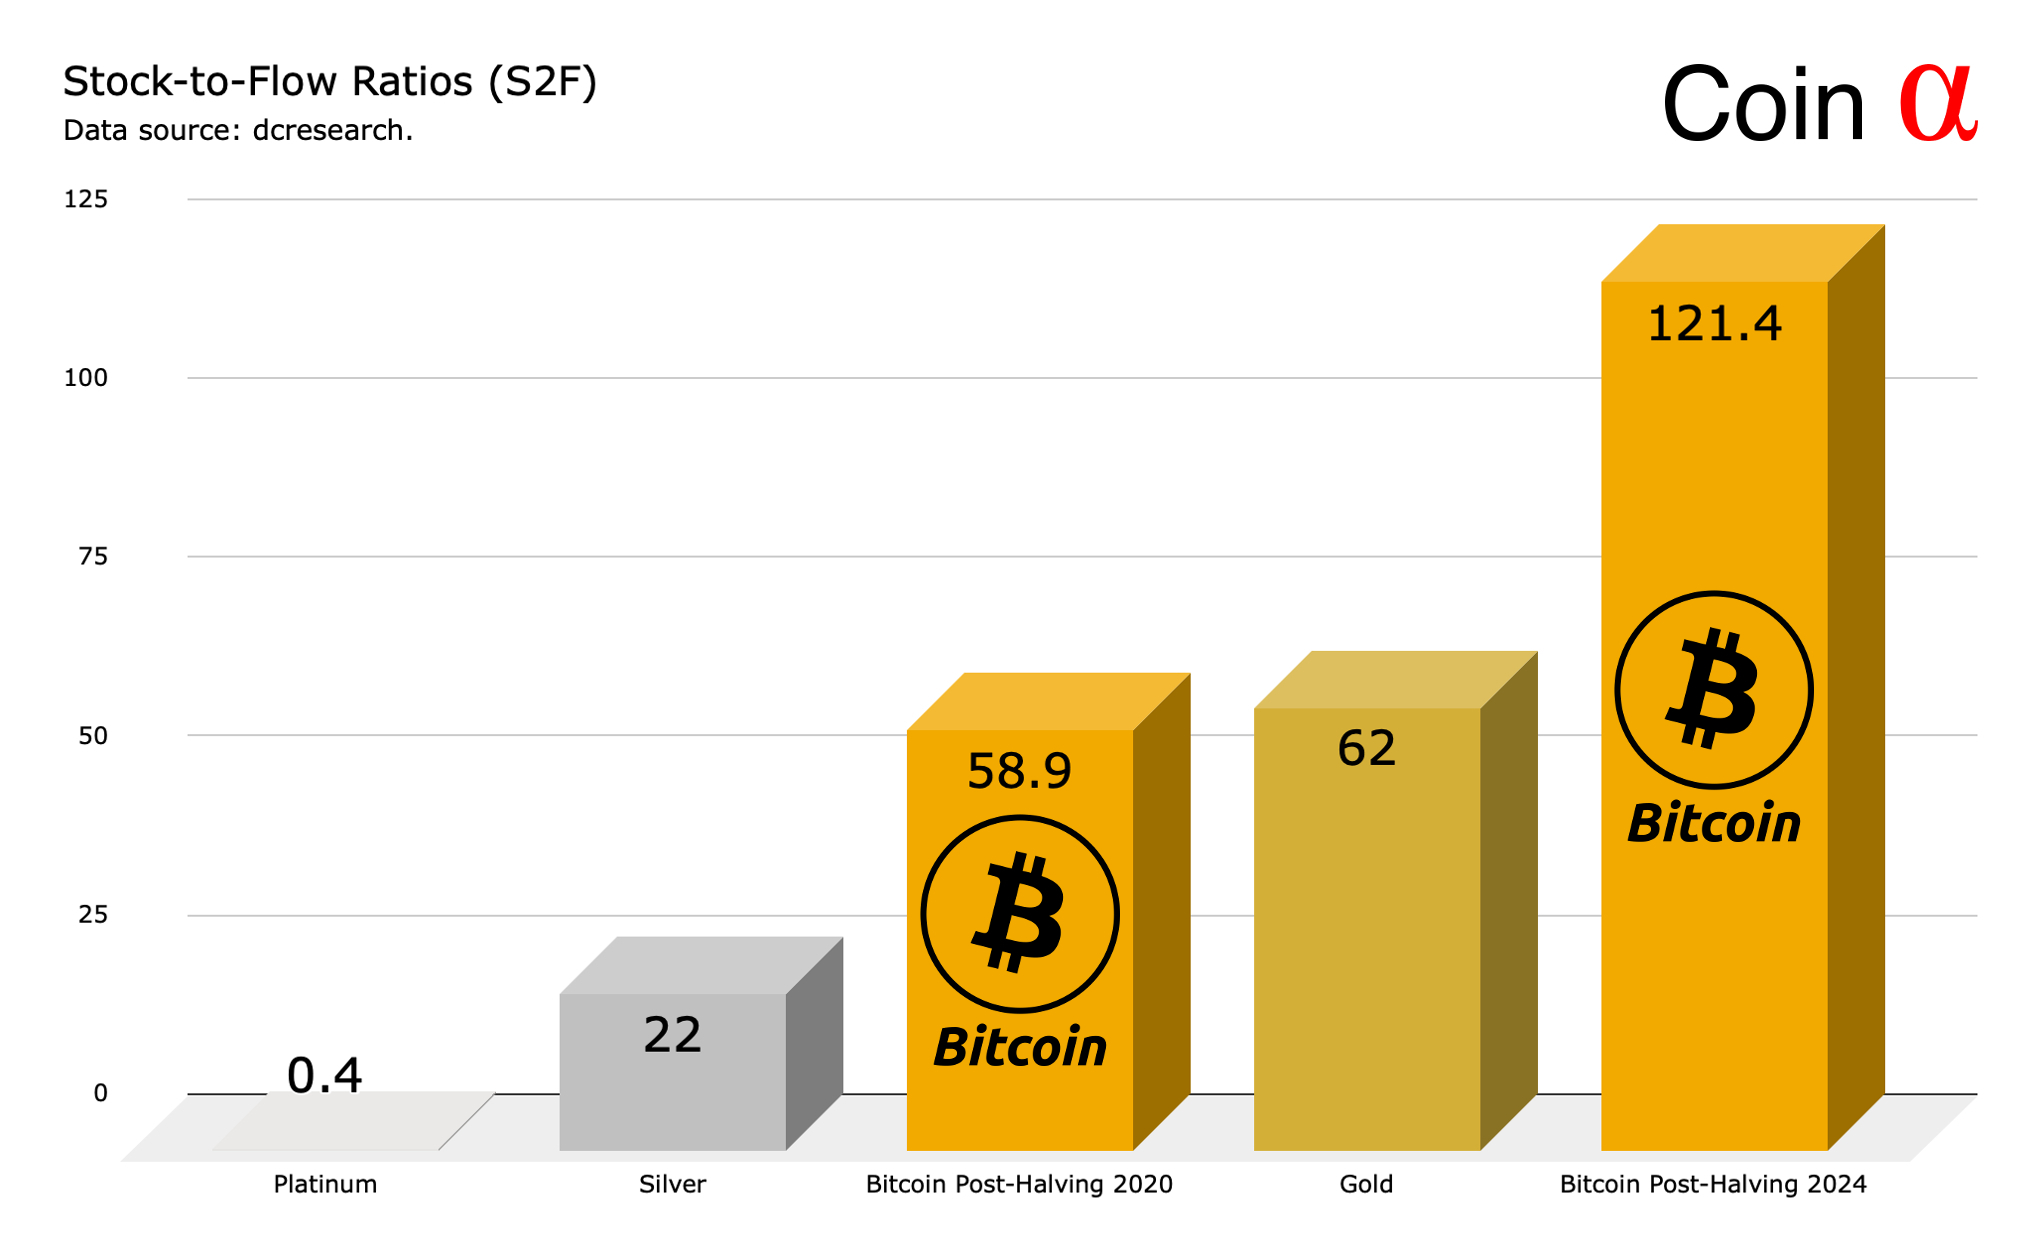
Stock-to-Flow (S2F) is defined as a relationship between production and current stock of an asset. When assessing stock-to-flow and its effect to Bitcoin, precious metals are a good benchmark. Platinum currently has a 0,4 S2F, which is relatively low. Silver however has 22 S2F, which is closer to bitcoin’s current S2F of 58,9. Gold’s current stock-to-flow is 62. The estimated S2F for bitcoin after 2025 halving will be 121,4, making Bitcoin extremely scarce. Let’s remember, only 21 million bitcoin units will ever exist.
Weakening Correlation
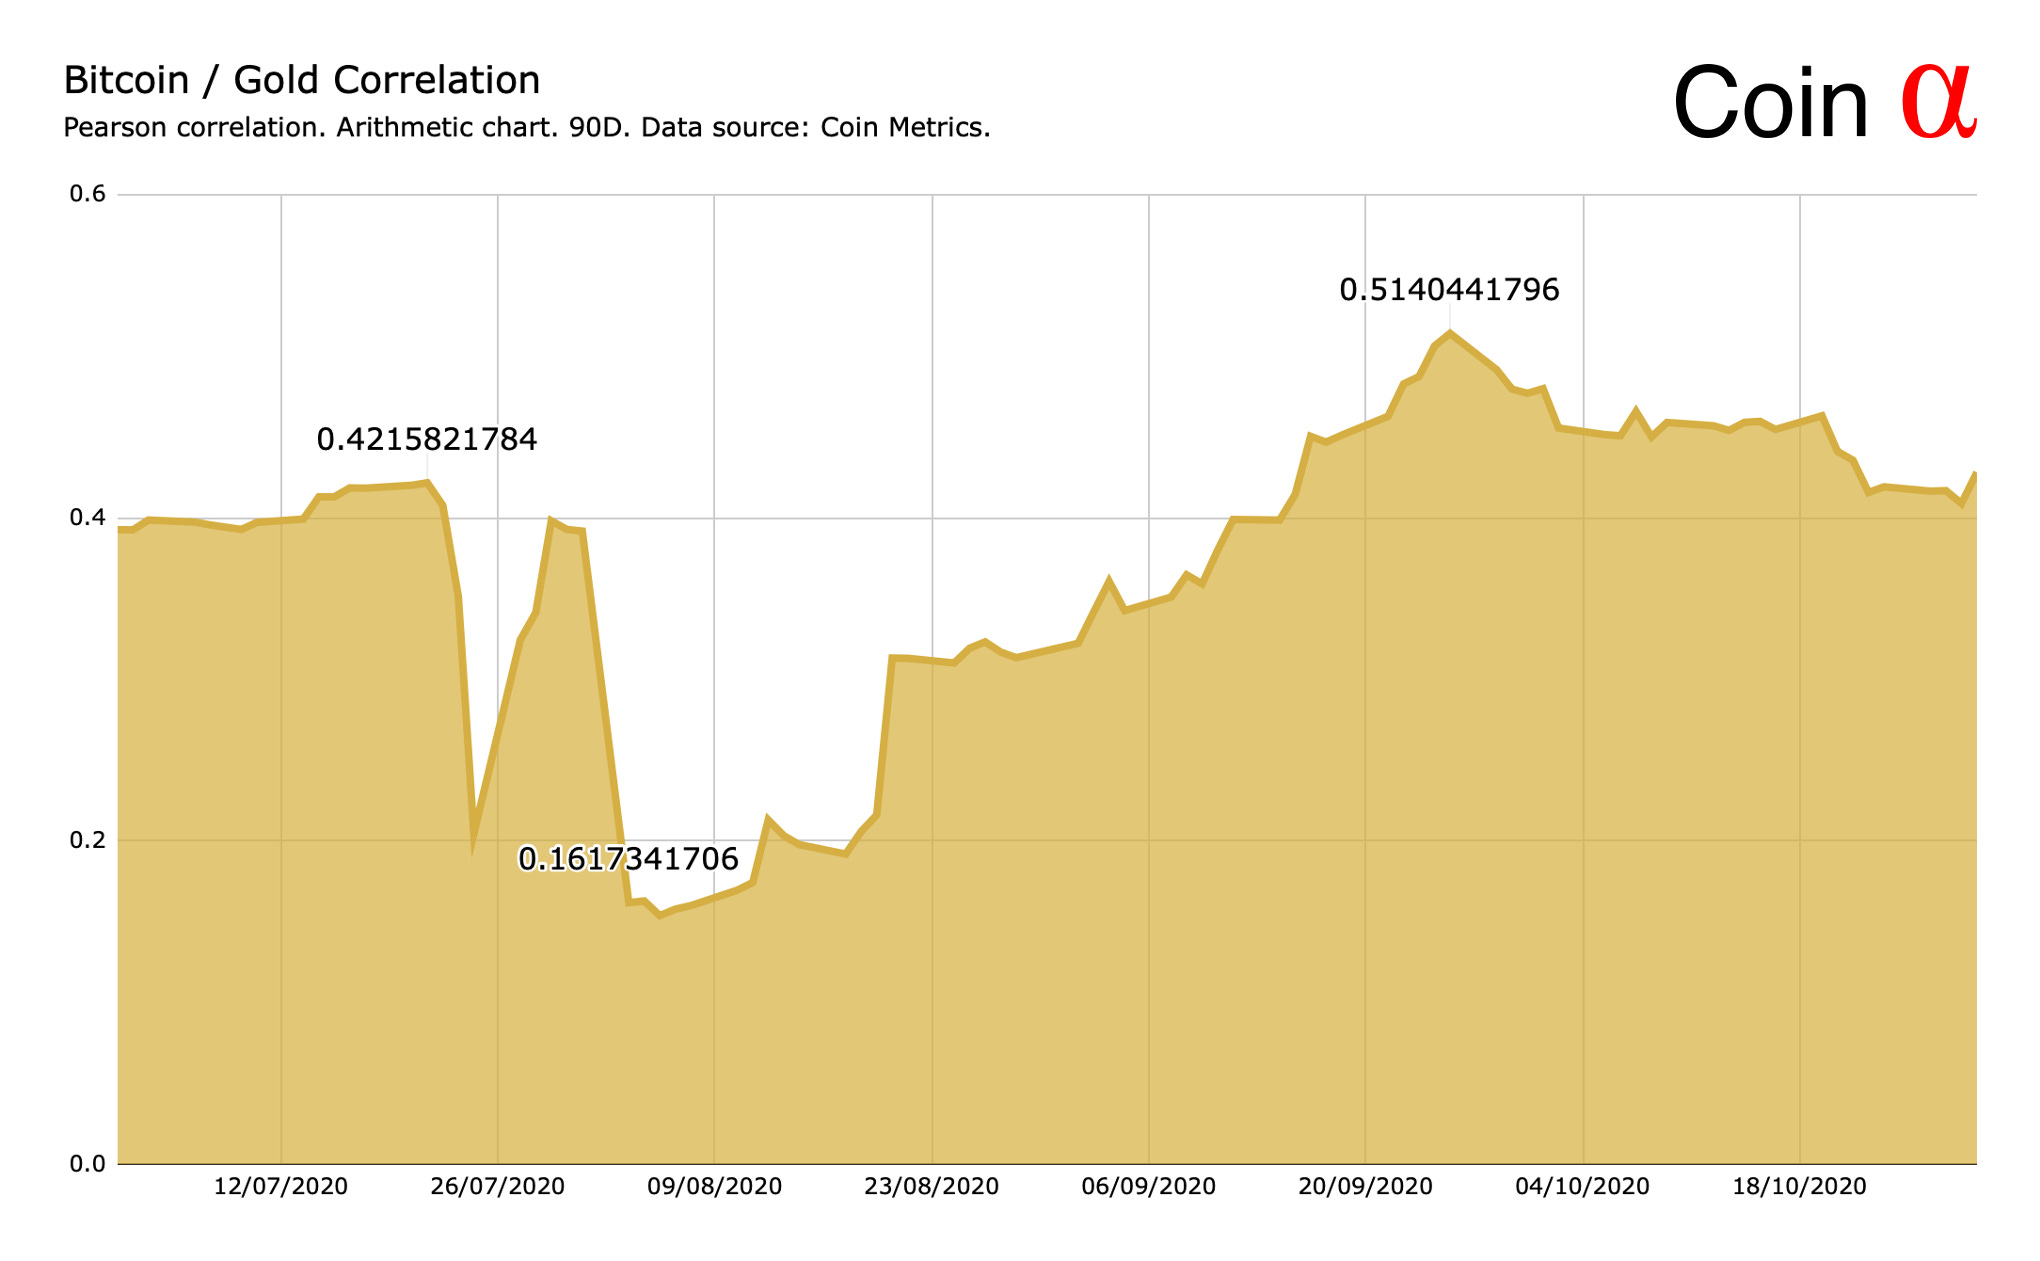
The average correlation between bitcoin and gold has been 0,37 since July. In early August bitcoin / gold correlation dropped to a H2 low, 0,16. The correlation has climbed since, hitting 0,51 in late September. Due to the growing divergence in asset prices, the correlation has been declining towards the end of 2020, possibly forming a new divergent trend between the two scarce assets.
Bitcoin and Ethereum Leading Sharpe Ratios
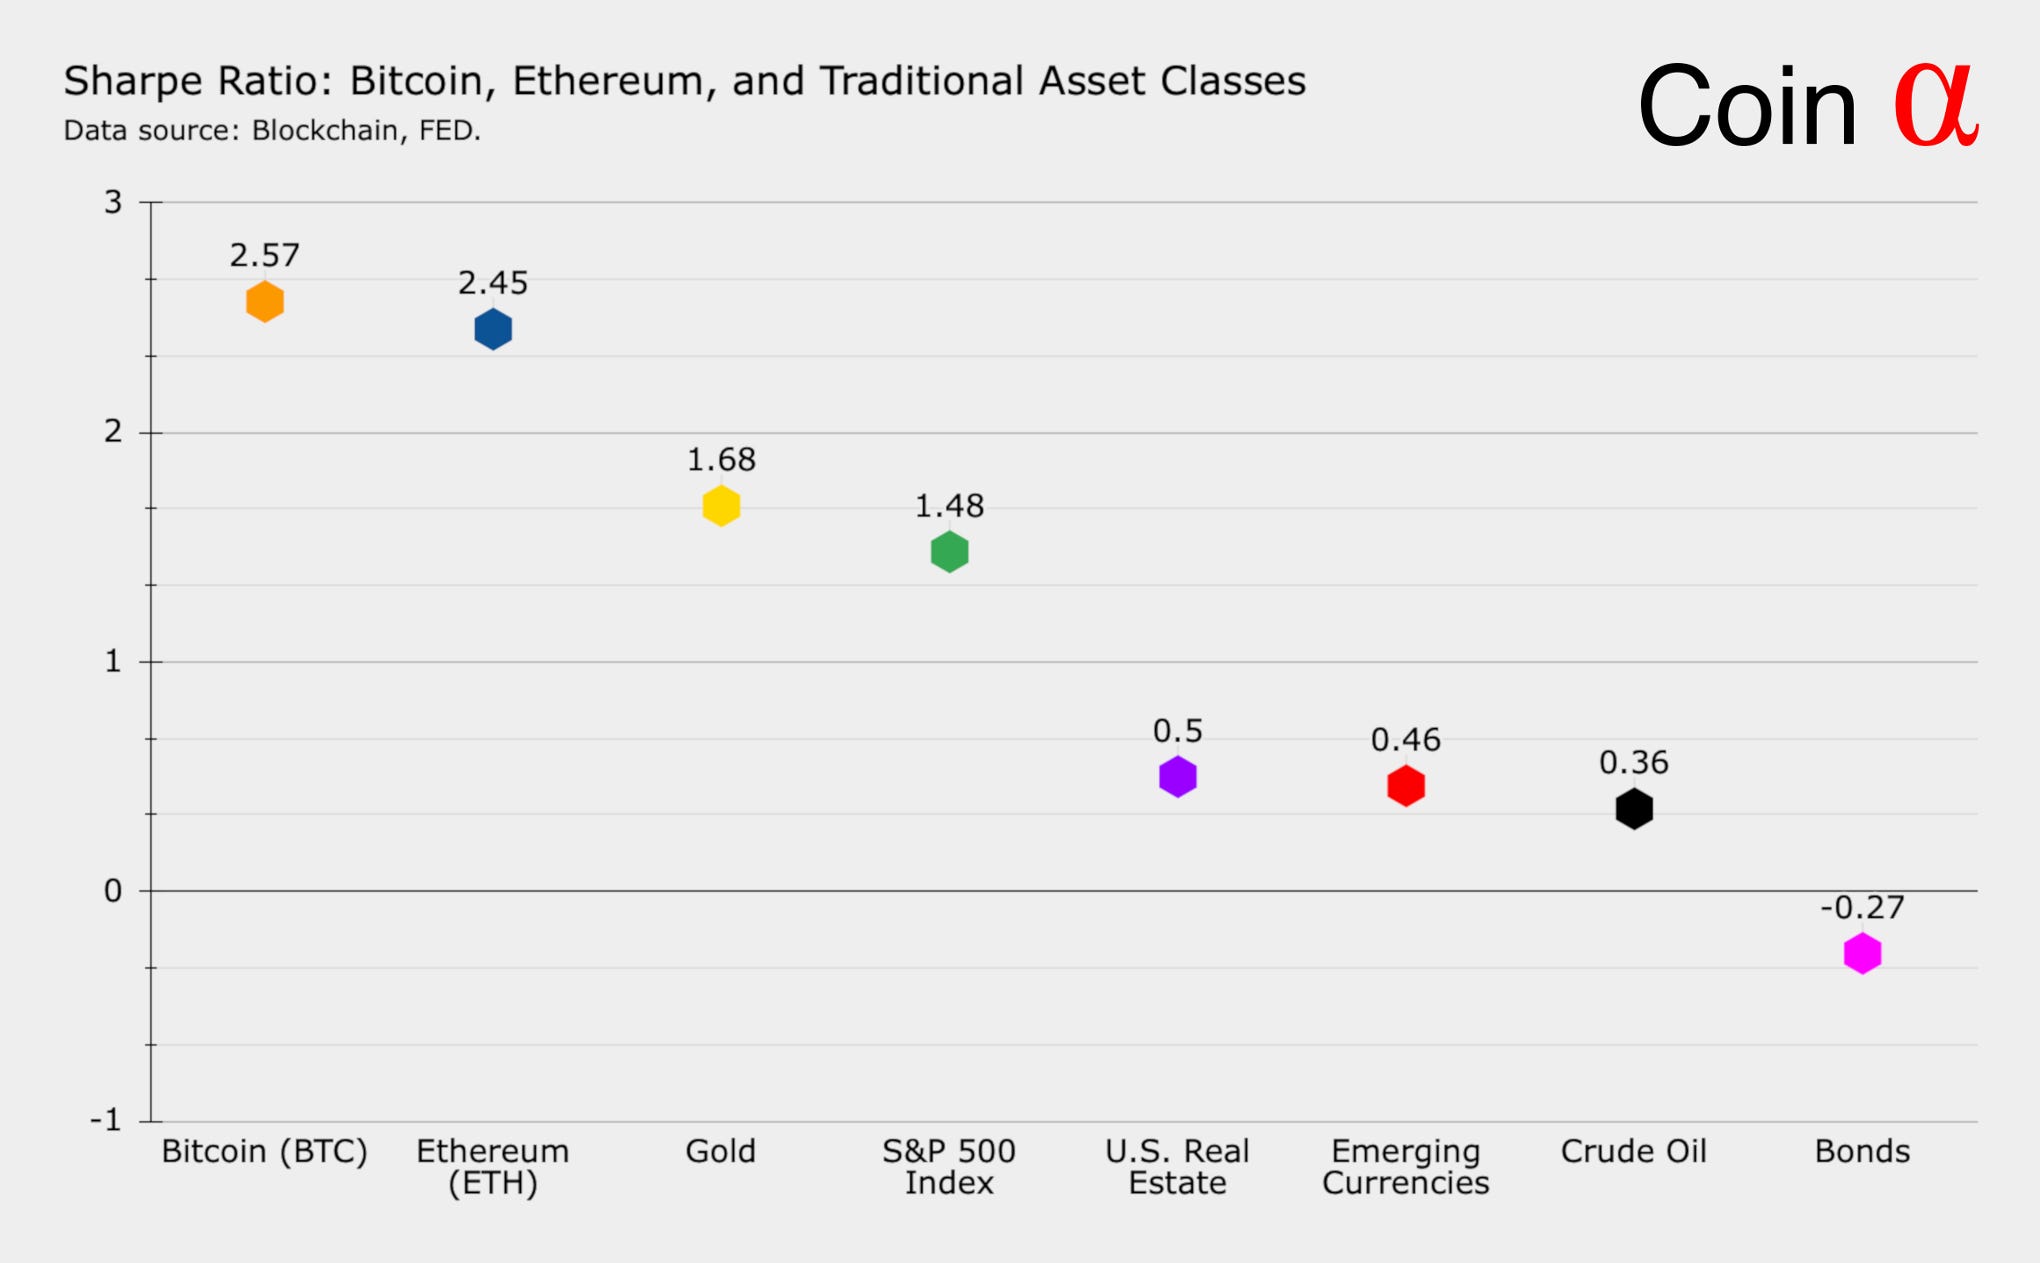
Sharpe Ratio is used to measure the performance of an asset by comparing it to a risk-free asset, adjusting for its risk. Sharpe ratio can also be considered as the information ratio for a dollar neutral strategy, being neither long or short the market.

When exploring Sharpe ratios for digital and traditional assets, Bitcoin (BTC) and Ethereum (ETH) prominently differentiate from the rest. Bitcoin’s Sharpe ratio is currently 2,57 and Ethereum’s 2,45, both considered to be very good. Gold, often used as Bitcoin’s benchmark, has a Sharpe ratio of 1,68, well below the digital assets yet still a good result. S&P 500 Index has a Sharpe of 1,48, an acceptable result. Below 1 Sharpe ratios are considered as suboptimal, U.S. real estate (0,5), emerging currencies (0,46), and crude oil (0,36) fall into the said category.
Sharpe Ratio of <1 = Suboptimal.
Sharpe ratio of >1 = Acceptable.
Sharpe ratio of >2 = Very good.
Sharpe ratio of >3 = Excellent.
Want to Know More?
Subscribe to Coin Alpha’s future updates here on Substack.
Editor: Timo Oinonen. LinkedIn. Twitter.
Disclosure: The information provided is for informational purposes only and is subject to change without notice. The information presented in Coin Alpha should not be construed as investment advice.