Coin Alpha: October 2020 Outlook


What is Alpha?
Alpha, the first letter of Greek alphabet (α), is a generally used financial term to describe a strategy’s excess return compared with the market or a benchmark. Alpha is investor’s “edge” against the broader market. Alpha is frequently used together with beta (β), which portrays market’s overall volatility and systematic risk.
As an increasing amount of investors are looking to gain exposure to digital asset field, we recognized a growing demand for more mature market-related information and intelligence. On these grounds we decided to call our publication “Coin Alpha”, its core purpose being to provide essential information to institutional, HNWI, and retail investors in the scene.
Information Asymmetry
As Gordon Gekko (Wall Street, 1987) famously said: “The most valuable commodity I know of is information”. Market-related information and intel is key for achieving success during the volatile cycles. As digital asset markets are largely unregulated, the effect of information asymmetry is even greater here.
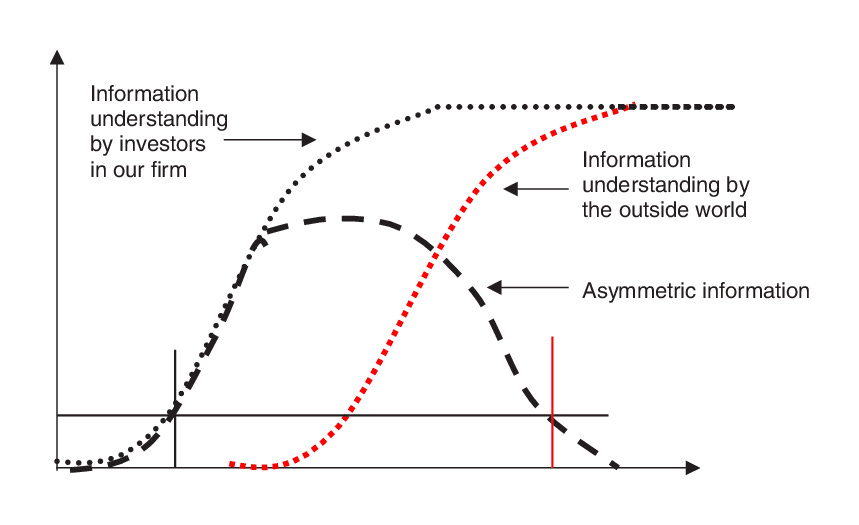
The purpose of Coin Alpha is to bring our subscribers closer to key information and reduce the information asymmetry gap.
Allocation Model for Digital Assets
In this segment we want to propose a model allocation for each month, consisting of most significant digital asset classes, including Bitcoin (BTC), Ethereum (ETH), Large-Cap, Mid-Cap, Small-Cap, and DeFi (Decentralized Finance). The assets are evaluated by placing them in five following categories:
R -- (Reduce)
R - (Slightly reduce)
0 (Neutral)
A + (Slightly accumulate)
A ++ (Accumulate)
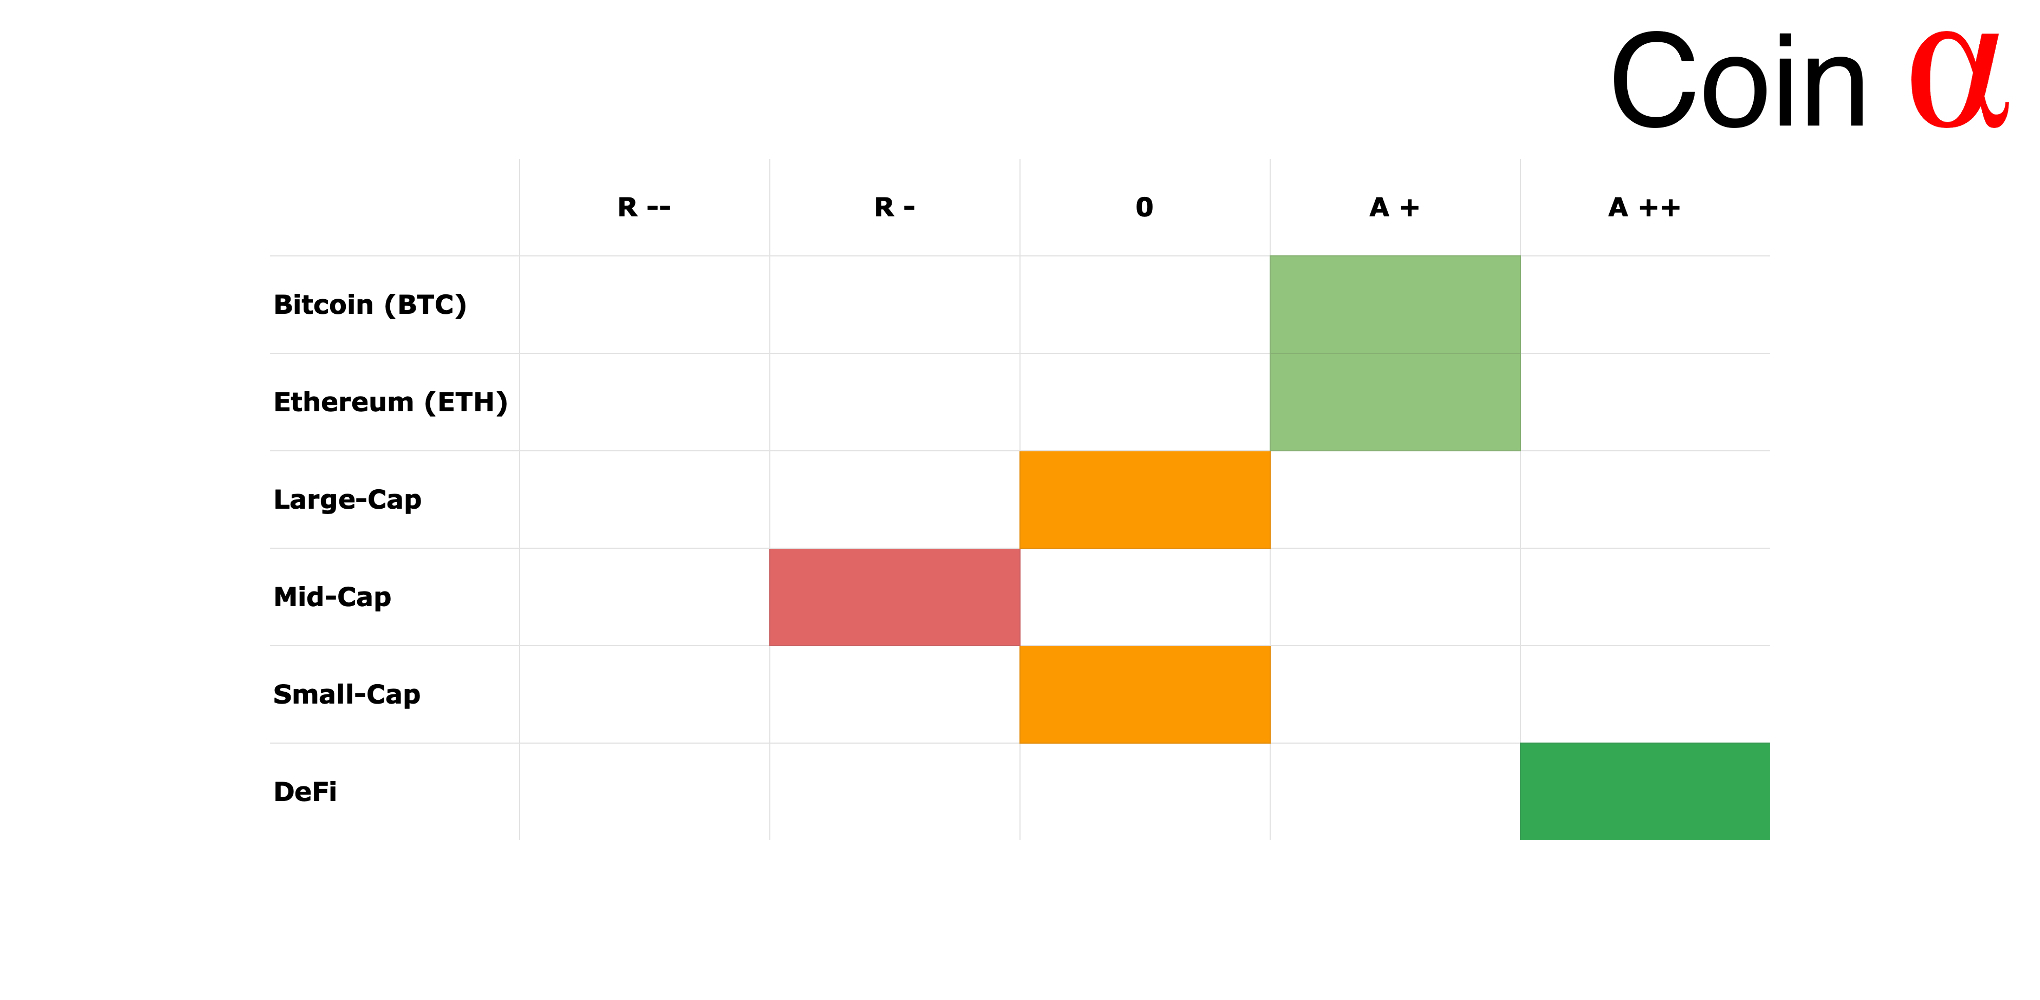
Bitcoin (BTC) / A +
A+ means it’d be advised to moderately accumulate the asset. Bitcoin’s fundamentals are looking good and it has been able to retain its position as the leading digital asset. We’re expecting to see inherent future demand for the leading digital asset.
Ethereum (ETH) / A +
Ethereum is also placed in the A+ category. Ethereum is the main ecosystem and platform for future decentralized finance (DeFi) and decentralized applications (dapp). Ethereum’s future growth will be fueled by increasing amount of decentralized future products and services.
Large-Cap / 0
Large-Cap digital assets, usually the top 10 cryptocurrencies, are in the neutral (0) category. The cryptocurrencies with large market caps are likely to be correlated with bitcoin, yet they might be eclipsed by the escalating amount of decentralized finance projects.
Mid-Cap / R -
Mid-Cap digital assets are estimated to fall into slightly negative territory (R -). The Mid-Cap digital assets are usually projects with medium-sized market caps and cryptocurrencies in this segment are somewhat old. As they’re less known by retail, some of them might easily be replaced by future DeFi products.
Small-Cap / 0
Small-Cap digital assets, usually the mass of cryptocurrencies with small market caps are placed in the neutral (0) category. Small-Caps are usually niche-class cryptocurrencies making them highly volatile and easy to eclipse. Small-Caps offer considerable upside for a skillful trader, but they might be notoriously illiquid.
DeFi / A ++
DeFi, or Decentralized Finance, assets have been placed in the A ++ (accumulate) category. DeFi platforms are quickly expanding in value and quantity, we expect DeFi to be one of the major drivers for cryptocurrency industry in upcoming years.
ETH/BTC Flippening?
Huobi futures contracts recorded more volume for Ethereum (ETH) than bitcoin (BTC) during mid-September, recent data shows the situation to be close to 50-50.
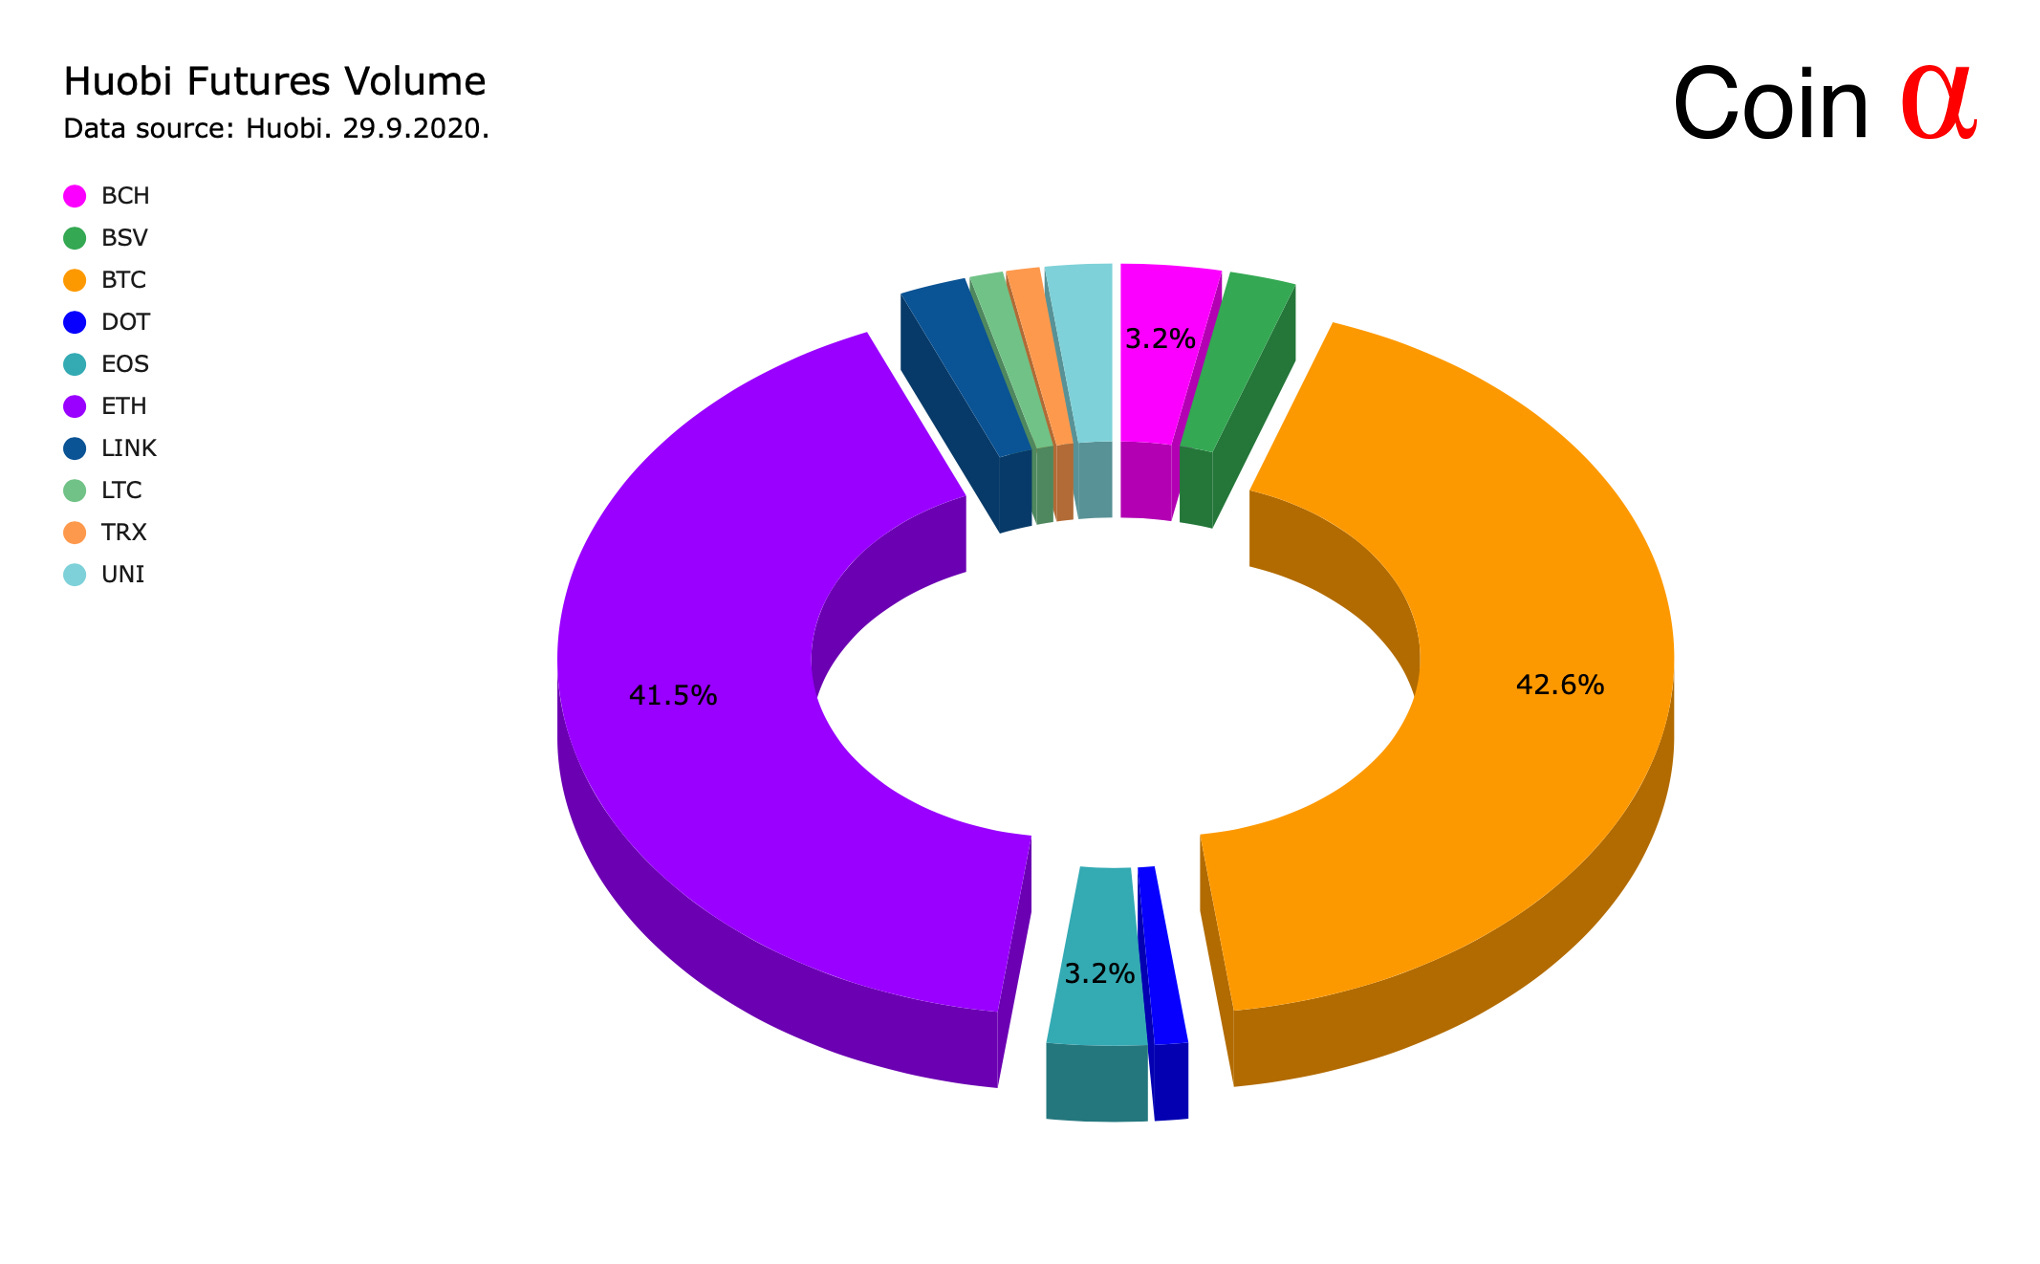
Ethereum has also been outperforming bitcoin (BTC/ETH) by 54,5% within one year, mainly fueled by the expanding DeFi industry. However Ethereum’s market cap ($40,89 billion) is still a mere 1/5 of bitcoin’s MCAP ($199,91 billion).
DeFi (Decentralized Finance)
Decentralized Finance, abbreviated as DeFi, has emerged as the leading contemporary blockchain-related paradigm. DeFi can be described as the cluster of applications and companies offering financial services based on decentralized blockchain technology. The estimated amount of DeFi users has skyrocketed during 2020, rising from January 98 398 users to September 417 119.

Compared with the traditional centralized financial service sector, DeFi’s main value proposition is to solve the inherent challenges related to the old finance industry. The most notable drawbacks of “old finance” are considered to be single points of failure and control, monopolizing power, and bureaucracy.
DeFi projects have experienced an incredible year performance-wise, with platforms like Aave (LEND token) rising 11539,9% in just one year. We strongly believe that decentralized finance is still in its early stages with distinctive upside potential.
Bitcoin Futures COT Analysis (CME)
When evaluating futures, the COT report (Commitments of Traders Report), is one of the most important information sources. The COT report is published every Friday at 3:30pm ET by CFTC (Commodity Futures Trading Commission) to provide market participants with a breakdown of open interest positions.
When exploring COT data from July to September 2020, we can see leveraged (hedge) funds being notably net short, on average 2000 contracts net short for each week. Nonreportable positions (banks) were heavily net long, rising from early July 1485 net long contracts to late September 2813 contracts. Asset managers have started to increase their long contracts towards the tail-end of 2020.

A futures contract in general is an instrument for hedging positions and reduce the risk of an unknown future. It is also used for arbitrating between current spot and future contracts. In the case of bitcoin, futures have been closely associated with miners who may face the risk of unknown future bitcoin prices.
MVRV Looking Bullish
Bitcoin MVRV is calculated by dividing the market cap by realized cap. MVRV is a good instrument for estimating if market participants are in profit or not. Negative MVRV ratio indicates market participants being not in profit, or minimally in profit. Positive MRVR indicates asset holders likely being in profit, respectively. Bitcoin is generally considered as overvalued when MVRV exceeds 3,7 and undervalued when it’s below 1.
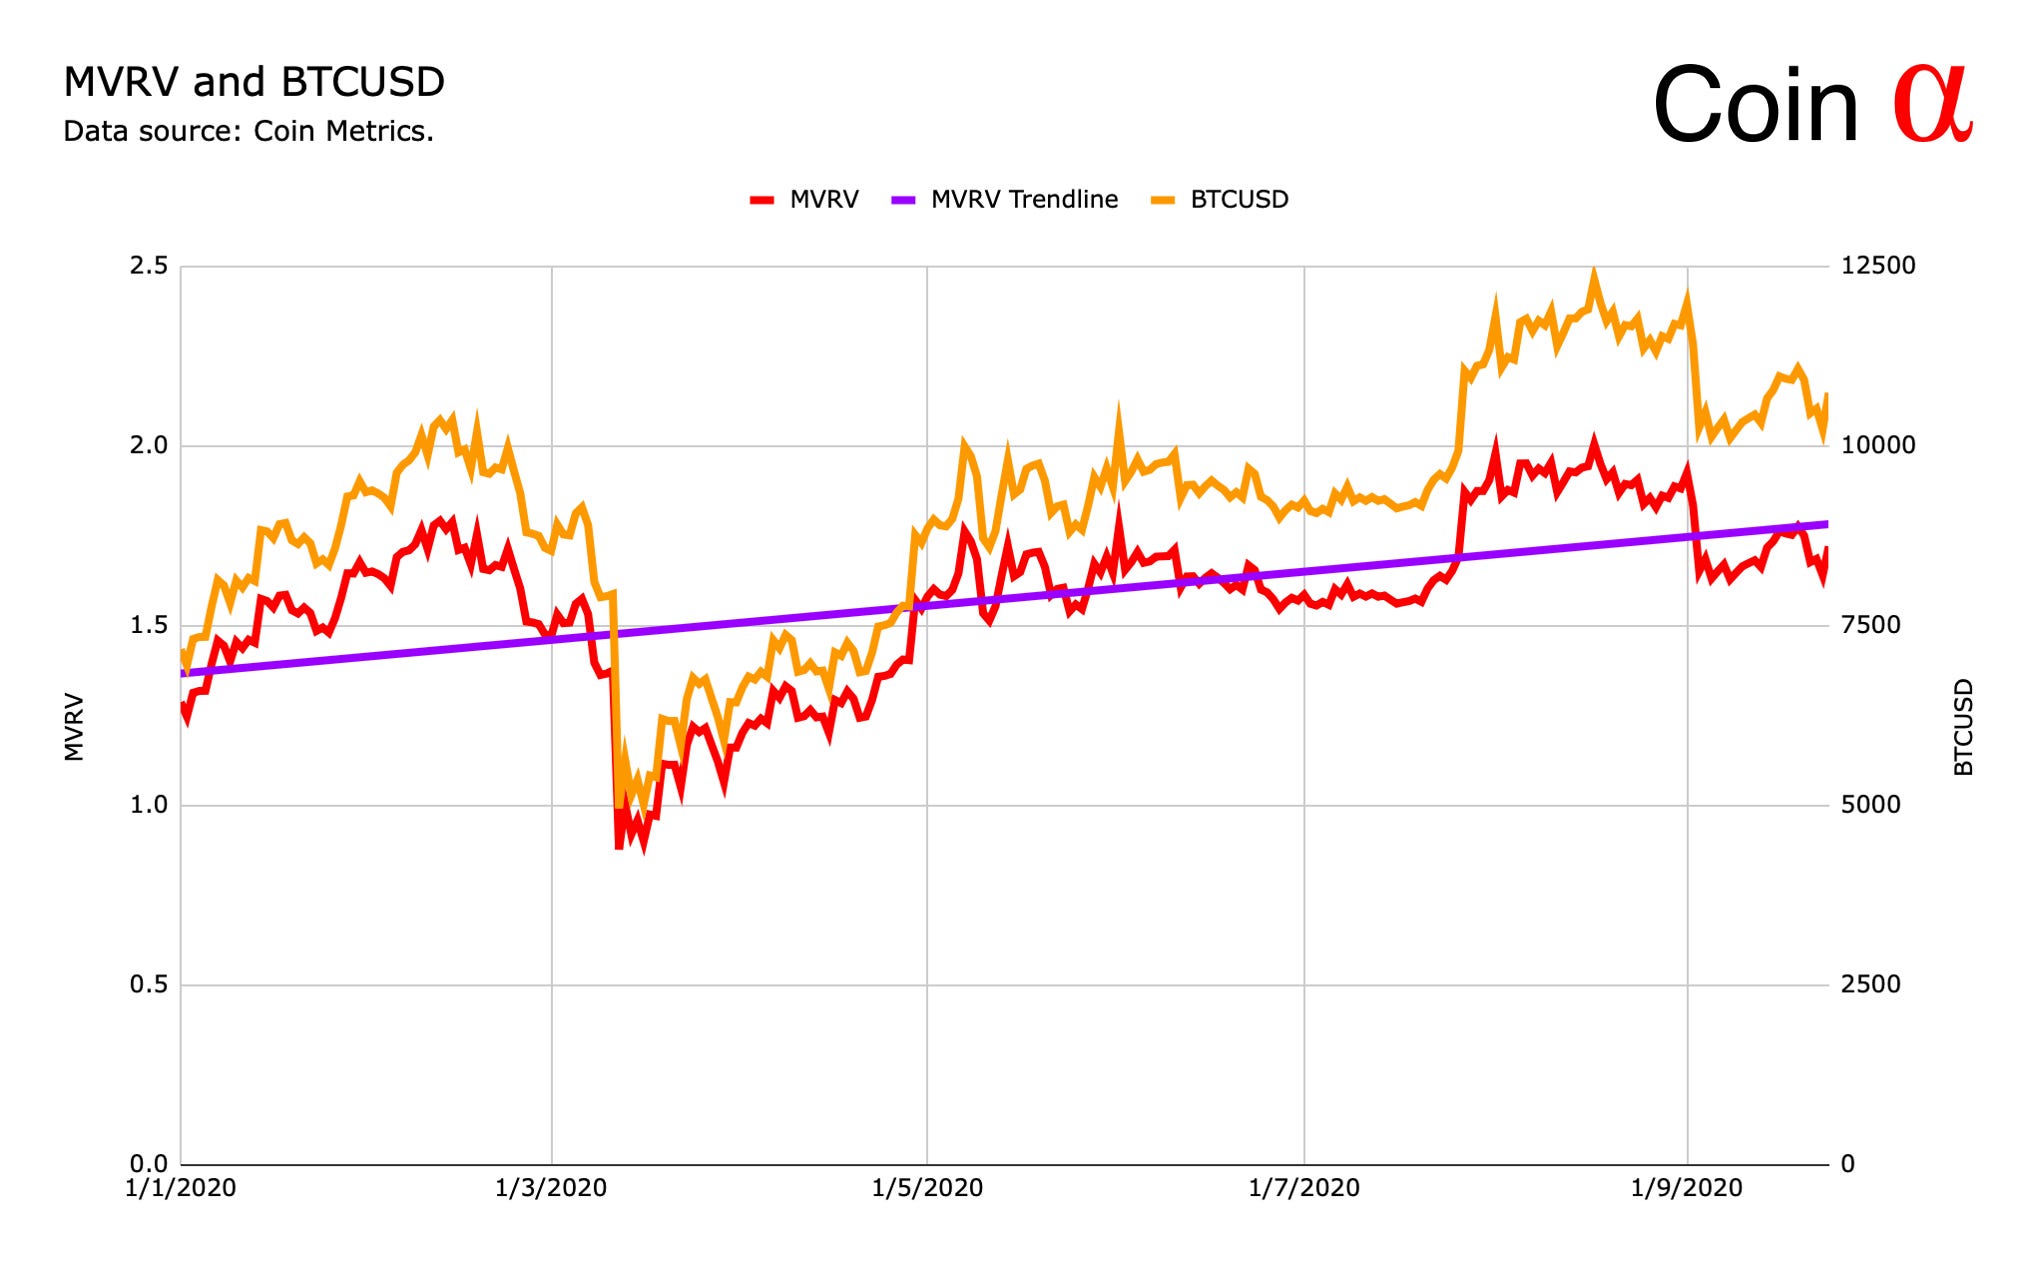
Bitcoin’s average MVRV (2020 YTD) has been 1,57. Early march below 1 MVRV indicated clear undervaluation and additionally MVRV is nowhere near 3,7 (overvaluation). Mirrored to bitcoin’s price performance, MVRV of 1,57 indicated a reasonable price for BTC, leaving room for price increase before possible overvaluation.
UTXO Age Distribution and BTCUSD
Each time bitcoins are sent, the network creates a new UTXO. The age of UTXO points to which block the particular transaction was first added and representing the last time when said bitcoin was moved. UTXO data allows bitcoin analysts to track the last time coins have moved.
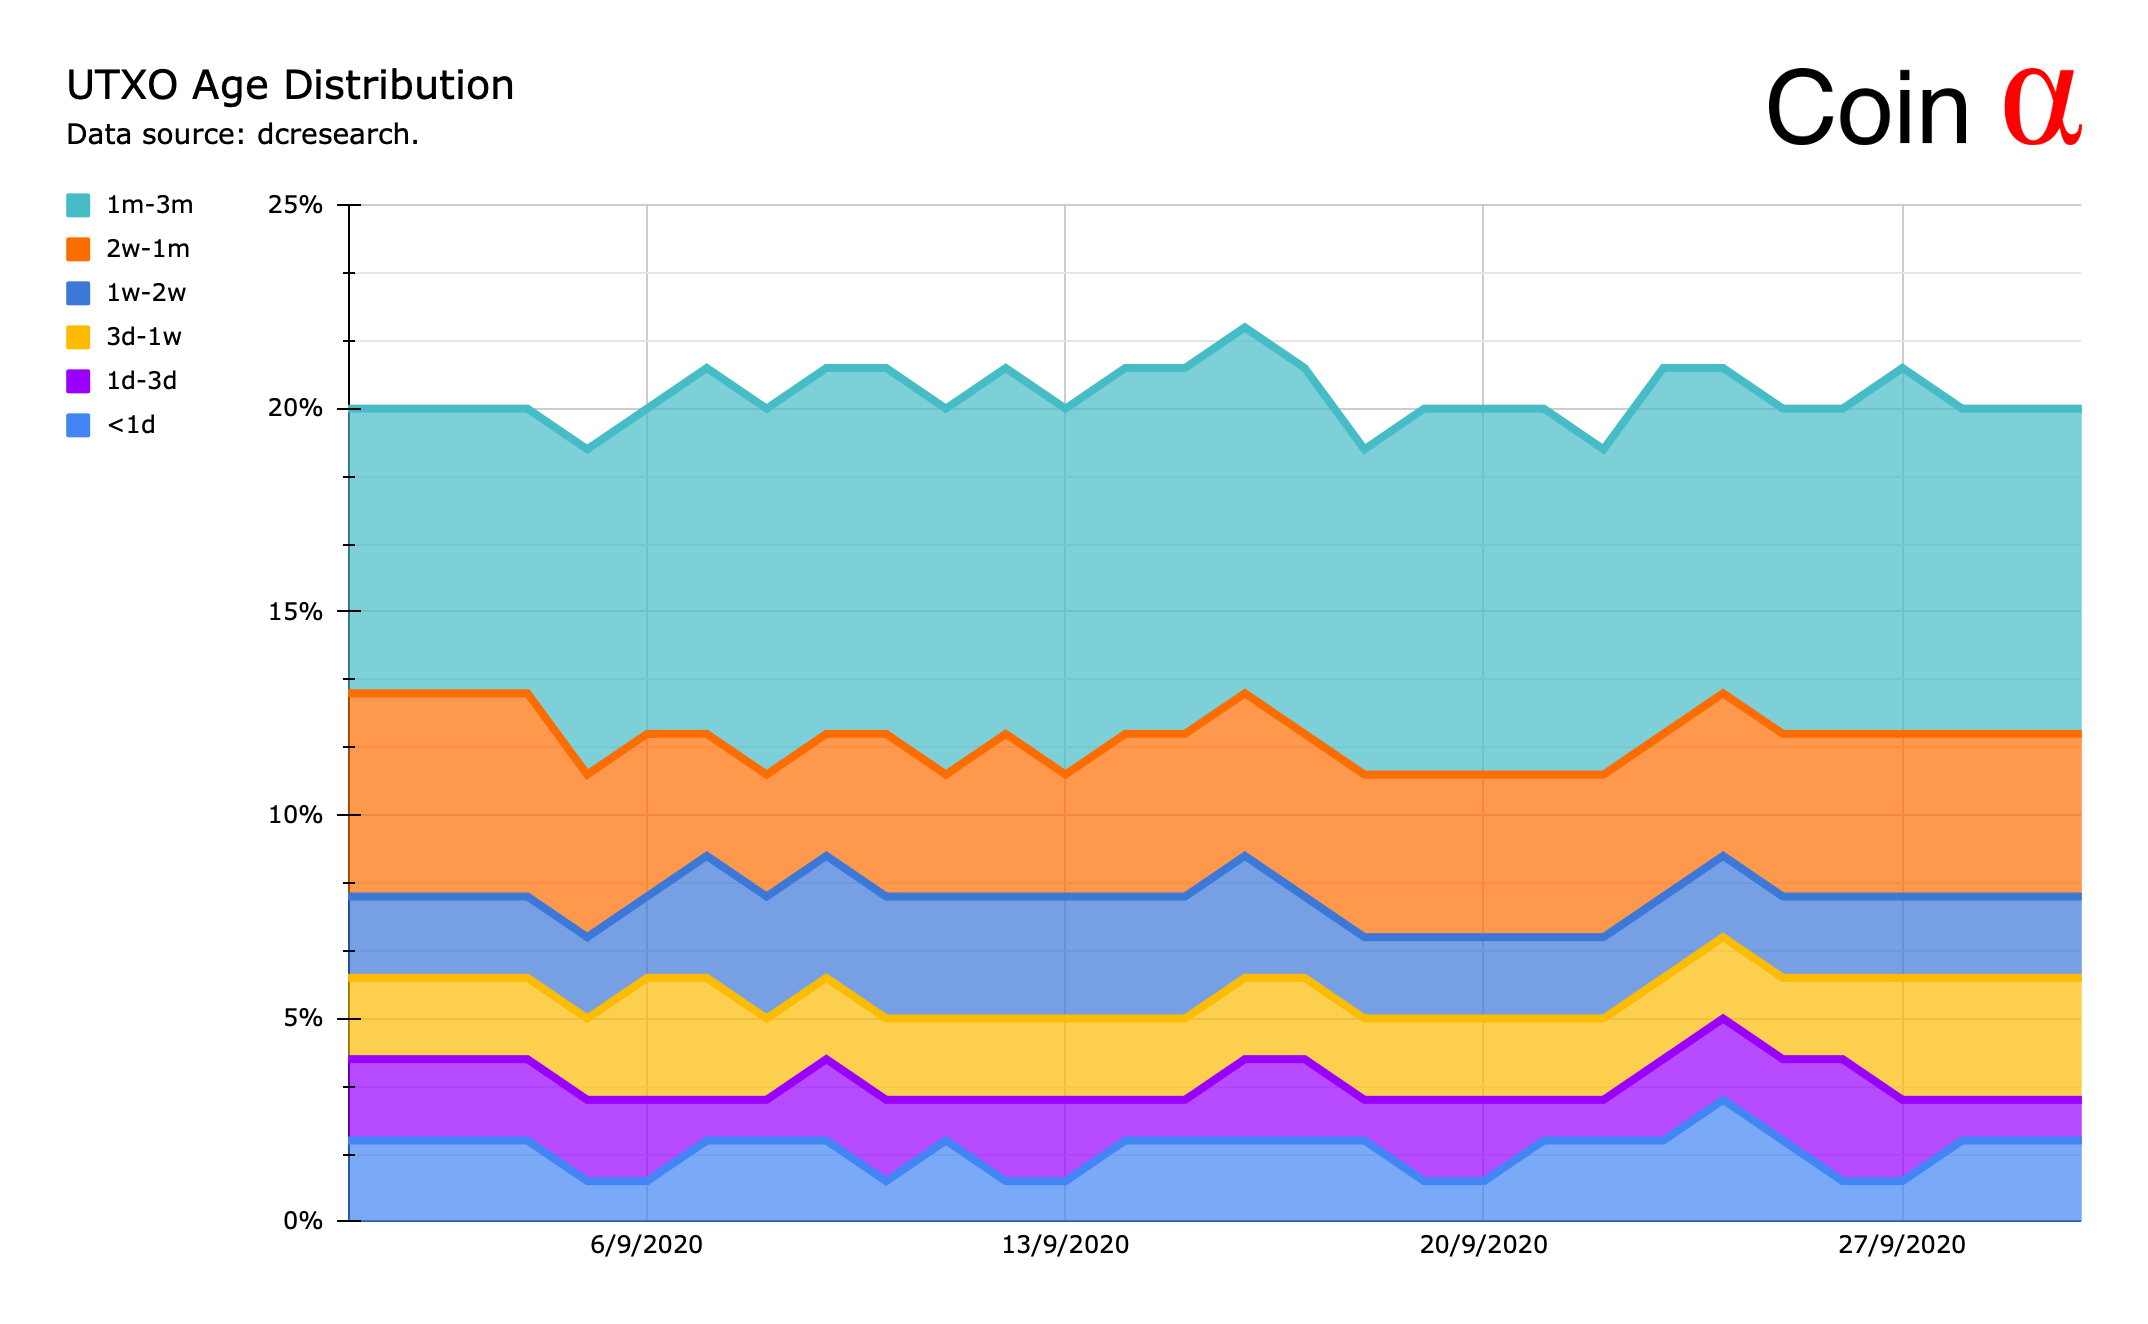
Construing UTXO age distribution allows for pinpointing crucial bitcoin market cycles and by historical data, multiple key UTXO bands are correlated with BTCUSD price movements. When looking at September 2020 UTXO data, we can see slight increase in smaller UTXO bands (3d-1w), possibly indicating retail accumulation.
Want to Know More?
Subscribe to Coin Alpha’s future updates here on Substack.
Editor: Timo Oinonen. LinkedIn. Twitter.
Disclosure: The information provided is for informational purposes only and is subject to change without notice. The information presented in Coin Alpha should not be construed as investment advice.